Some Numerical Results for Periodic Boundary Conditions
By Linda Stals
A study of the nonlinear behaviour of the Hasegawa-Wakatani equations has been carried out and documented in arXiv:1107.0112. Additional simulations highlighting some of the results for periodic boundary conditions are available below.
By studying the Hasegawa-Wakatani equations in the Fourier domain, we can readily show that any initial guess that starts with zero everywhere except the (0, ± 1) mode will grow exponentially. The centre-manifold analysis carried out on a low-mode approximation suggests that the (0, ± 1) mode will grow exponentially irrespective of the initial guess. Our numerical simulation indicate that this result is also true when additional modes are included in the simulation.
Note that it is important to carry out the simulations on an appropriately sized grid. If the computational domain is too small, the qualitative behaviour of the solution will be incorrect.
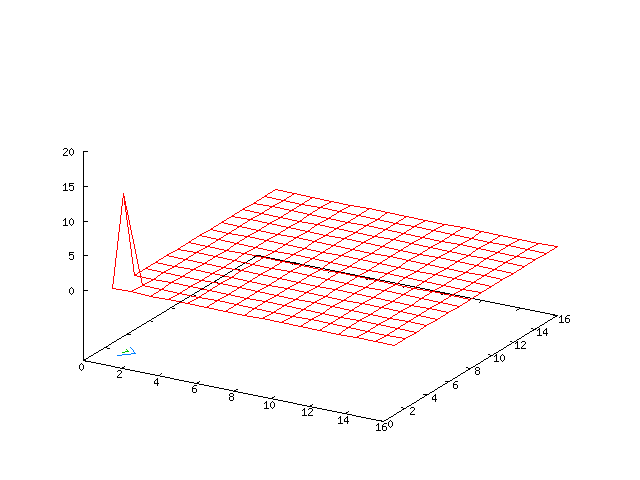
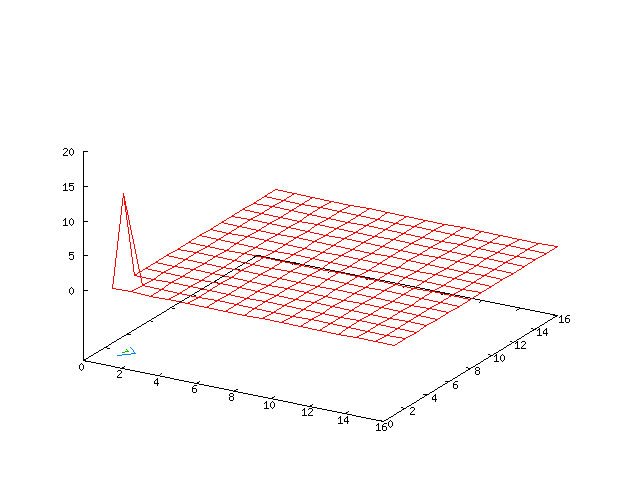
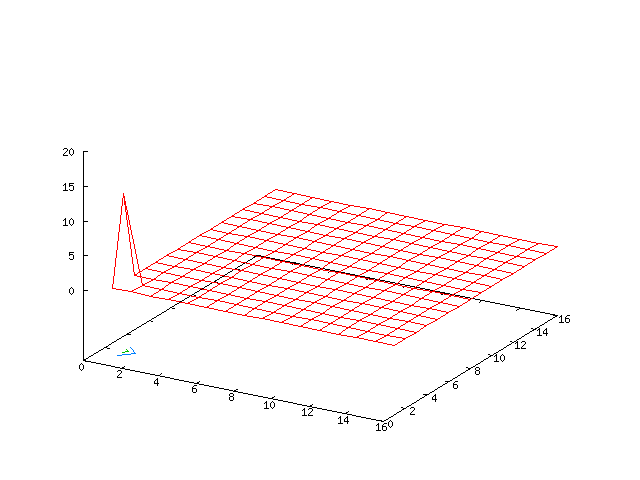
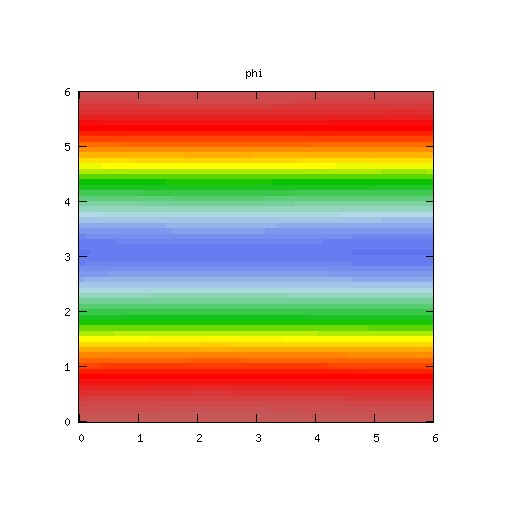
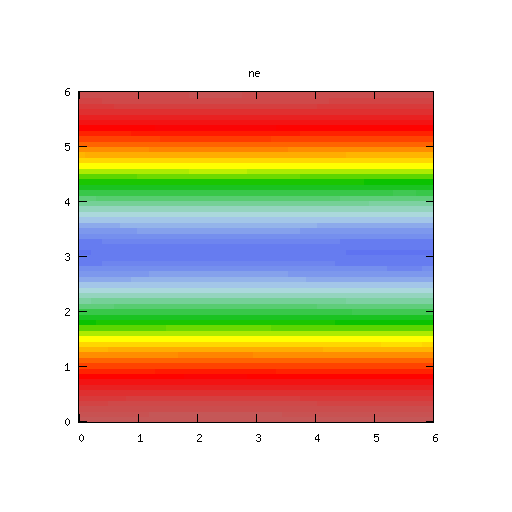
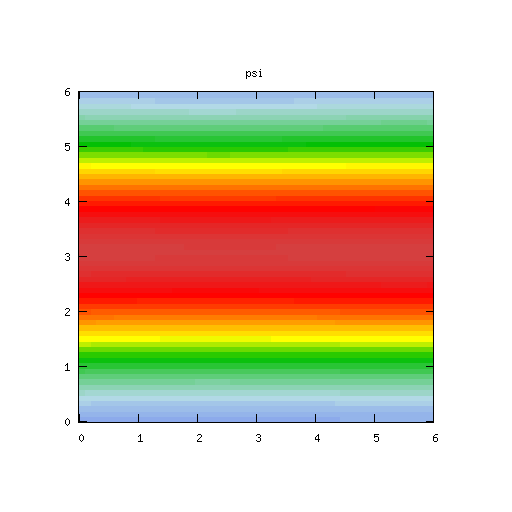
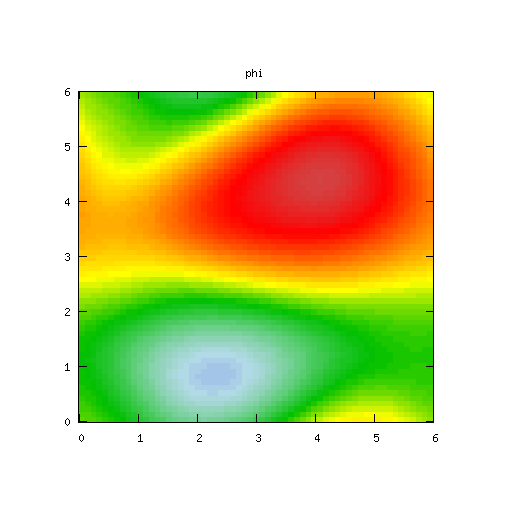
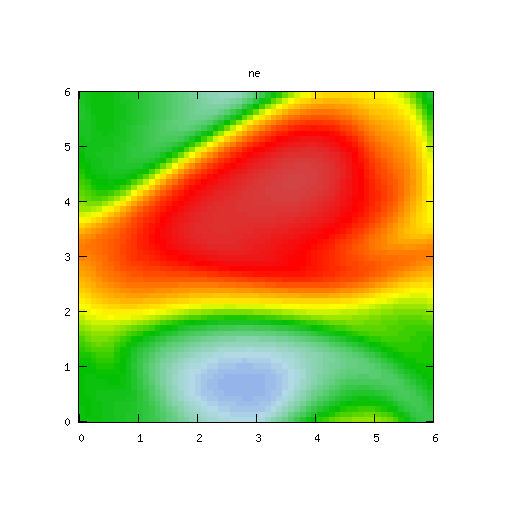
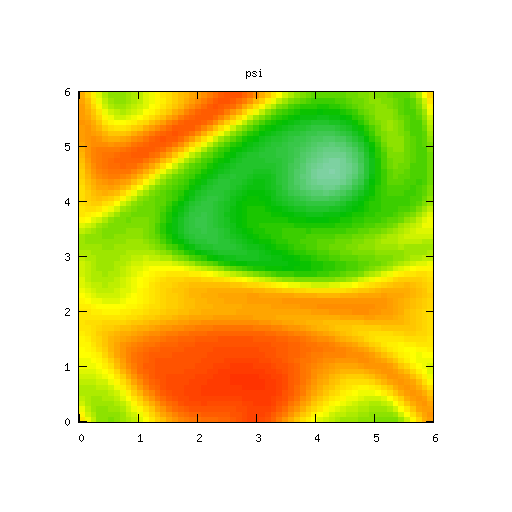
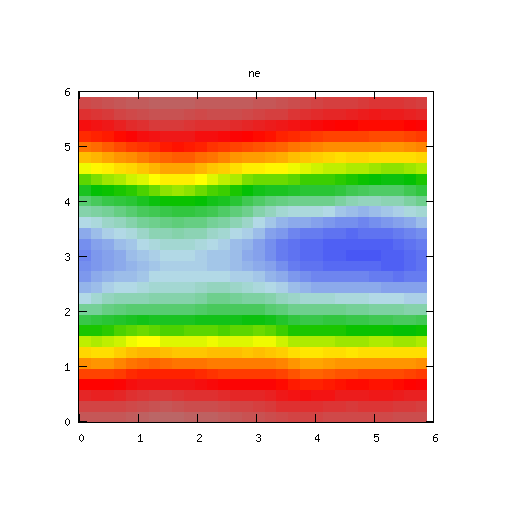
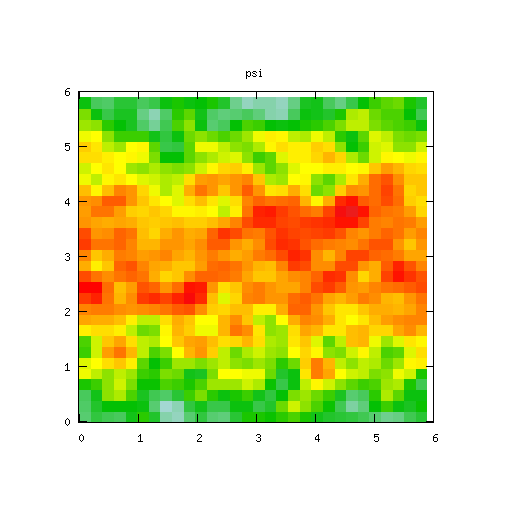
The three movies below show how the potential φ, density r and vorticity ∇2 φ change with time. The grid size is [0,2π/k]×[0, 2π/k] where k = 1. Click on the image to enlarge. For the Fourier mode simulations, we have only shown a 16×16 section of grid, the actual computational domain may be higher.
Low Mode Example
Results for p = 1, βr = β&phi = 0.1, κ = 1.5, α = 83, 0 ≤ t ≤ 2700 and computational grid size = 64 × 64
Based on an eigenvalue analysis of the linear part of the Hasegawa-Wakatani equation, we expect to find that nearly all of the frequency modes will be damped for this given set of parameters. As only the lower order modes influence the long term behaviour of the system, we can compare the numerical results with the behaviour predicted by the centre manifold analysis.
The centre manifold analysis shows that the solution is unstable for the given choice of parameters. By looking at the simulations in Fourier space (first table of movies), we can see a growth in the (0, ± 1) modes. When running the move it takes a little while for the growth to become apparent.
| Potential | Density | Vorticity |
|
|
|
It takes a little while for the growth in the solution to become apparent in the time domain plots.
| Potential | Density | Vorticity |
|
|
|
High Mode Example
Results for
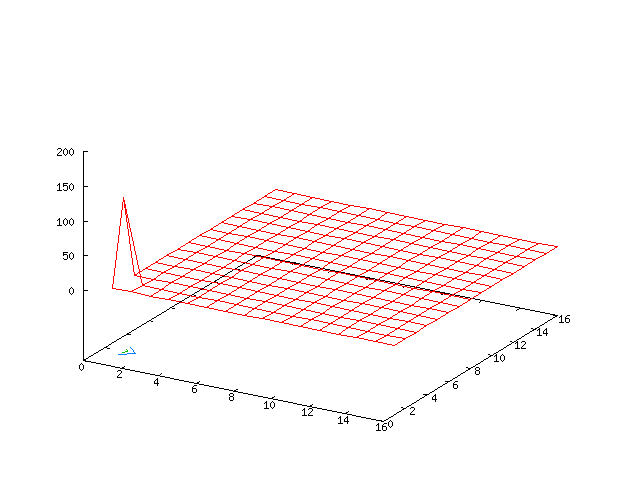
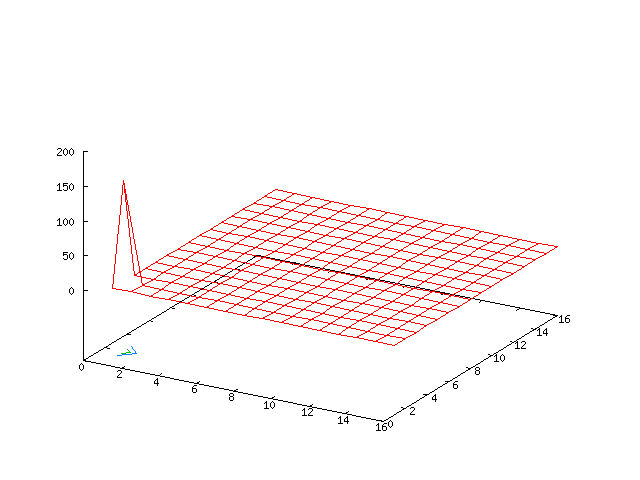
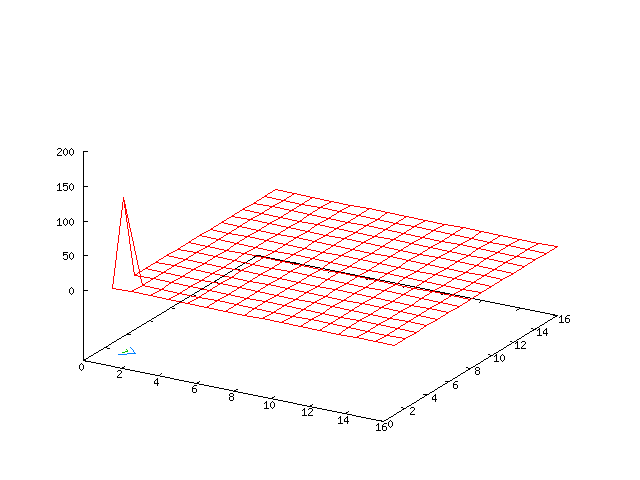
With the given parameters we expect a number of the Fourier modes to contribute to the long-term behaviour of the system, nevertheless, the growth in the (0, ± 1) modes predicted by the centre manifold analysis is still evident.
| Potential | Density | Vorticity |
|
|
|
| Potential | Density | Vorticity |
|
|
|
Small Grid Example
Results for p = 1, βr = β&phi = 0.1, κ = 1.5, α = 41 and computational grid size = 32 × 32
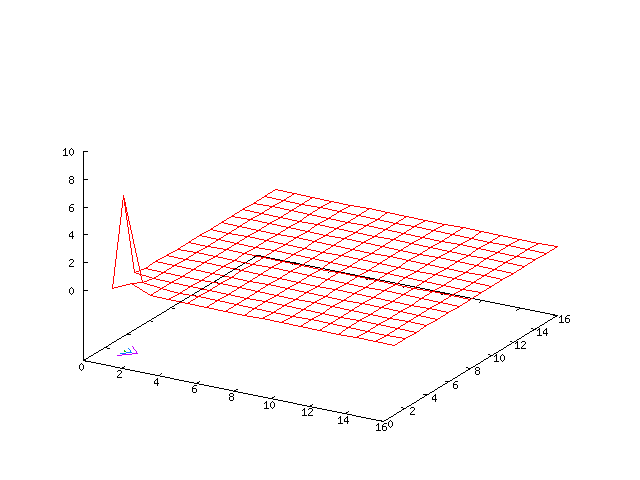
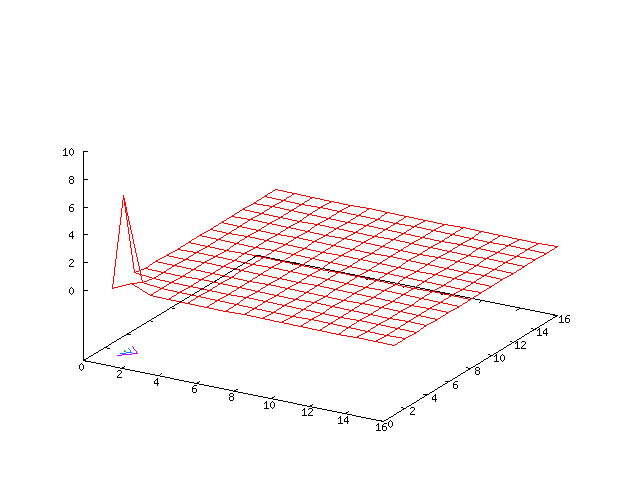
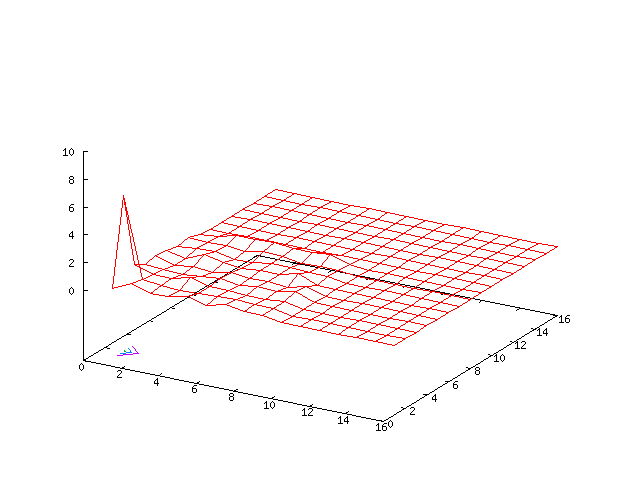
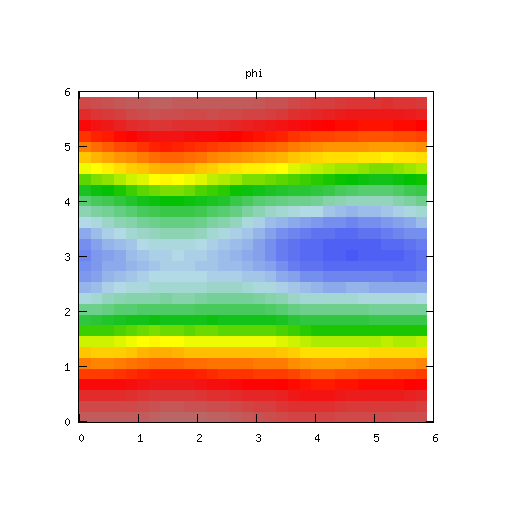
Our experimentation has shown that it is important to carry out the computations on the correct sized grids. The simulations below suggest the solution is stable, but the centre manifold analysis and simulations on larger sized grids show the solution is not stable.
We use 2/3rd dealiasing in the numerical computations, that is evident in the results for the vorticity in the Fourier domain.
| Potential | Density | Vorticity |
|
|
|
| Potential | Density | Vorticity |
|
|
|